Well Analysis 101!
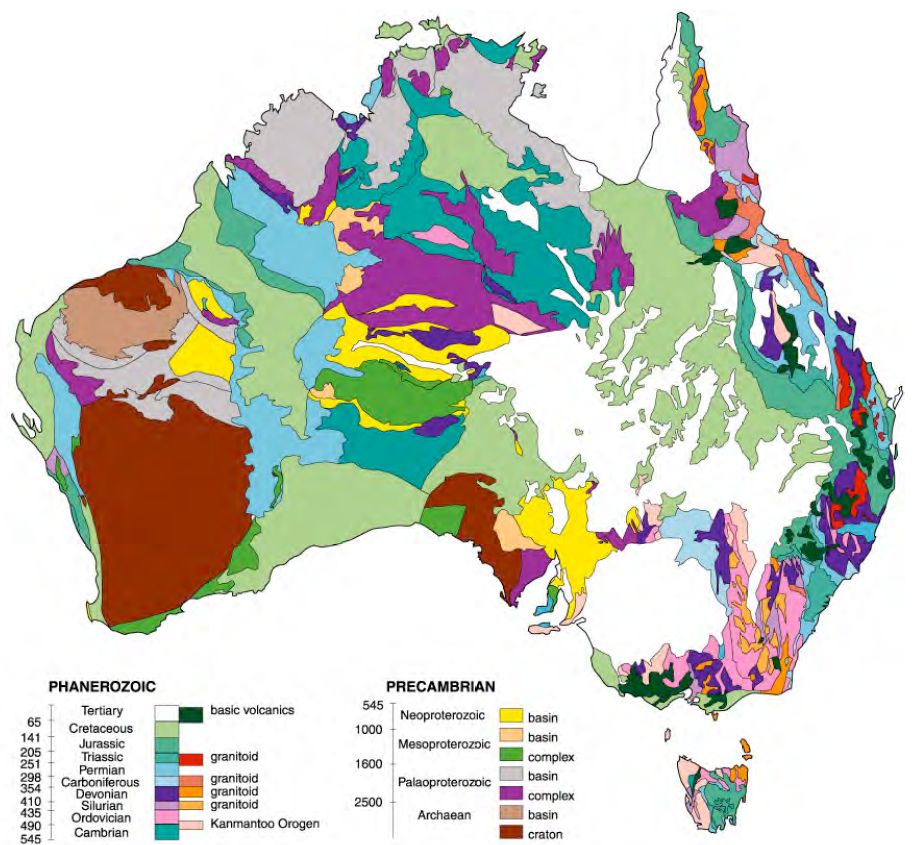
Saladin, Australia -->

Graph the Geophysics ↓
- conductivity
- radioactivity
- density
In [27]:
import itertools
import lasio
import pozo
import plotly.graph_objects as go

las = lasio.read("https://raw.githubusercontent.com/geopozo/pozo-demo/main/SALADIN.LAS")

tracks = (["CGR", "CALI"], ["LLD", "ILD", "ILM", "LLS"], ["RHOB", "NPHI"])
graph = pozo.Graph(las,  yaxis_name="DEPT:1", include=list(itertools.chain(*tracks)))}

graph.set_theme("cangrejo")
graph.get_theme().set_fallback("track_width", 150)
for group in tracks:
    graph.combine_tracks(*group)
graph.get_trace("RHOB").set_theme({"cross_axis_fill": "some name"})
graph.get_trace("NPHI").set_theme({"cross_axis_fill": ("some name", {}), "fillcolor": "yellow"})
graph.get_trace("CGR").set_theme({"fill": 'heatmap'})

graph.note_dict['Mardie Greensand'] = pozo.Note(1105, line=dict(color="#00FFFF"), text='Mardie Greensand')
graph.note_dict['Barrow Group'] = pozo.Note((1115, 1125), line=dict(color="green"), text='Barrow Group')

go.Figure(graph.render(height=800, depth_position=1, depth=[1100, 1300],))
In [19]:
go.Figure(graph.CrossPlot(
    x = graph.get_trace("NPHI"),
    y = graph.get_trace("RHOB"),
    colors = ["depth"],
    xrange=(45, -15),
    yrange=(1.95, 2.945),
    size=800,
    depth_range=(1100, 1300),
).render())